
A Housing Breakdown in Grand Rapids
As we enter the new year, one issue that we have thought about as a group within the Strong Towns Grand Rapids has been housing. We simply do not have enough housing across all segments of the market. A large part of understanding a problem is looking at the issue in the current form and then deciding on what is the root cause.
I wrote down these six questions before looking at any data.
What kind of housing do we have right now?
How old is the housing stock in GR?
What does the average house look like in GR?
What kind of changes have been happening in GR?
What kind of changes have been happening in GR?
What should we build going forward?
One thing to keep in mind while looking at this data is that they are estimates. From the Census notes:
Data are based on a sample and are subject to sampling variability. The degree of uncertainty for an estimate arising from sampling variability is represented through the use of a margin of error. The value shown here is the 90 percent margin of error. The margin of error can be interpreted roughly as providing a 90 percent probability that the interval defined by the estimate minus the margin of error and the estimate plus the margin of error (the lower and upper confidence bounds) contains the true value. In addition to sampling variability, the ACS estimates are subject to nonsampling error (for a discussion of nonsampling variability, see ACS Technical Documentation ). The effect of nonsampling error is not represented in these tables.

What kind of housing do we have right now?
Mostly the housing in GR is 1 unit, detached. The next largest segment is 20 or more units in a structure. This is referred to by housing experts as the missing middle, which has between 2 units per structure and 5-9 units per structure. These types of housing increases density within a structure, without increasing the footprint of the building. These types of developments can be cleverly integrated into neighborhoods to avoid changing the character of the neighborhood from single family housing, to more multi family housing. Some prime examples of these would be rowhouses commonly found in eastern seaboard cities.

How old is the housing stock in GR?
76.76% of structures that people live in have been built before 1979. The other 23.24% have been built in the last 44 years. Only 267 Structures have been build in the last 10 years.
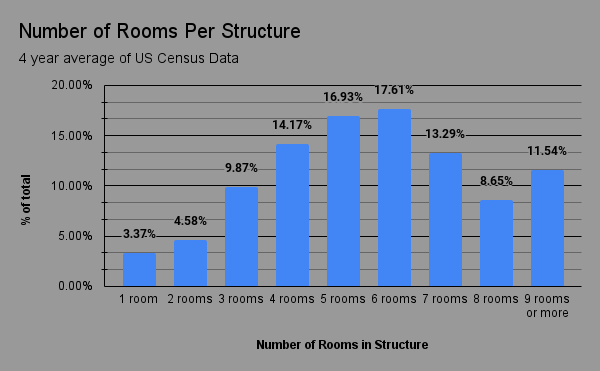
What does the average house look like in GR?
Unsurprisingly, the average house in Grand Rapids has a median number of rooms at 5.4, with between 2 and 3 bedrooms.

Value of Owner Occupied Units over the last 5 years.
The value of these housing structures has increased over time as well. The Median value has increased by $83,300 in the last 5 years!

A Breakdown of Owner Occupied Housing Values
Unfortunately though, it is not because we are building more housing. It is because valuations for houses have shifted, due to demand in the area for housing. Notice the shrinking segment of everything under $200,000. Starter homes are almost non-existent now in the Grand Rapids market.

Interestingly the number of household that have one car is the largest segment, in 2022.

What kind of changes have been happening in GR?
According to the US census data 30% of people have moved in 2017 and later. Another 20.7% have moved in between 2015 and 2016.
So the average Grand Rapids house looks like this:
A pre 1960’s construction with 5 rooms, 2 bedrooms and valued between 200k and 300k. The people living there most likely have moved into that house in the last 10 years and drive between 1 or 2 vehicles.

Rent or Buy?
Buying a home is only one way to live in Grand Rapids, and arguably the more static figure. The rental market in Grand Rapids has only been growing in the last 5 years.

The median rent in Grand Rapids has increased by $353 since 2018.

Changes in the Rental Market
Looking at trends here, we can see that the $500-$999 range has slowly shrinking. While at the same time $1000-$1499 range has increased in the same time and nearly doubled in 2022.
What should we build going forward?
To start with support the Zoning changes that are being proposed by the Grand Rapids Planning Commission! If you would like to learn more about the proposed changes you may read the meeting notes from the joint meeting with the City Commission here. This will open the door to allowing for increased density through small changes in the way we utilize existing spaces. Look for the full proposed plan by the Planning Commission, hopefully in towards the end of January.
-Anna Carley
Method:
Aggregate 2018-2022 (exception of 2020 data) for year to year comparisons. Calculated a 4 year average to set a baseline to compare where each year stands/ smooth out the census data which varied between years on some more static values.
Data Sources:
U.S. Census Bureau. "Selected Housing Characteristics." American Community Survey, ACS 1-Year Estimates Data Profiles, Table DP04, 2022, https://data.census.gov/table/ACSDP5Y2022.DP04?q=housing&g=160XX00US2634000. Accessed on January 8, 2024.U.S. Census Bureau. "SELECTED HOUSING CHARACTERISTICS." American Community Survey, ACS 1-Year Estimates Data Profiles, Table DP04, 2021, https://data.census.gov/table/ACSDP1Y2022.DP04?q=housing&g=160XX00US2634000. Accessed on January 8, 2024.U.S. Census Bureau. "SELECTED HOUSING CHARACTERISTICS." American Community Survey, ACS 1-Year Estimates Data Profiles, Table DP04, 2019, https://data.census.gov/table/ACSDP1Y2021.DP04?q=housing&g=160XX00US2634000. Accessed on January 8, 2024.U.S. Census Bureau. "SELECTED HOUSING CHARACTERISTICS." American Community Survey, ACS 1-Year Estimates Data Profiles, Table DP04, 2018, https://data.census.gov/table/ACSDP1Y2019.DP04?q=housing&g=160XX00US2634000. Accessed on January 8, 2024.